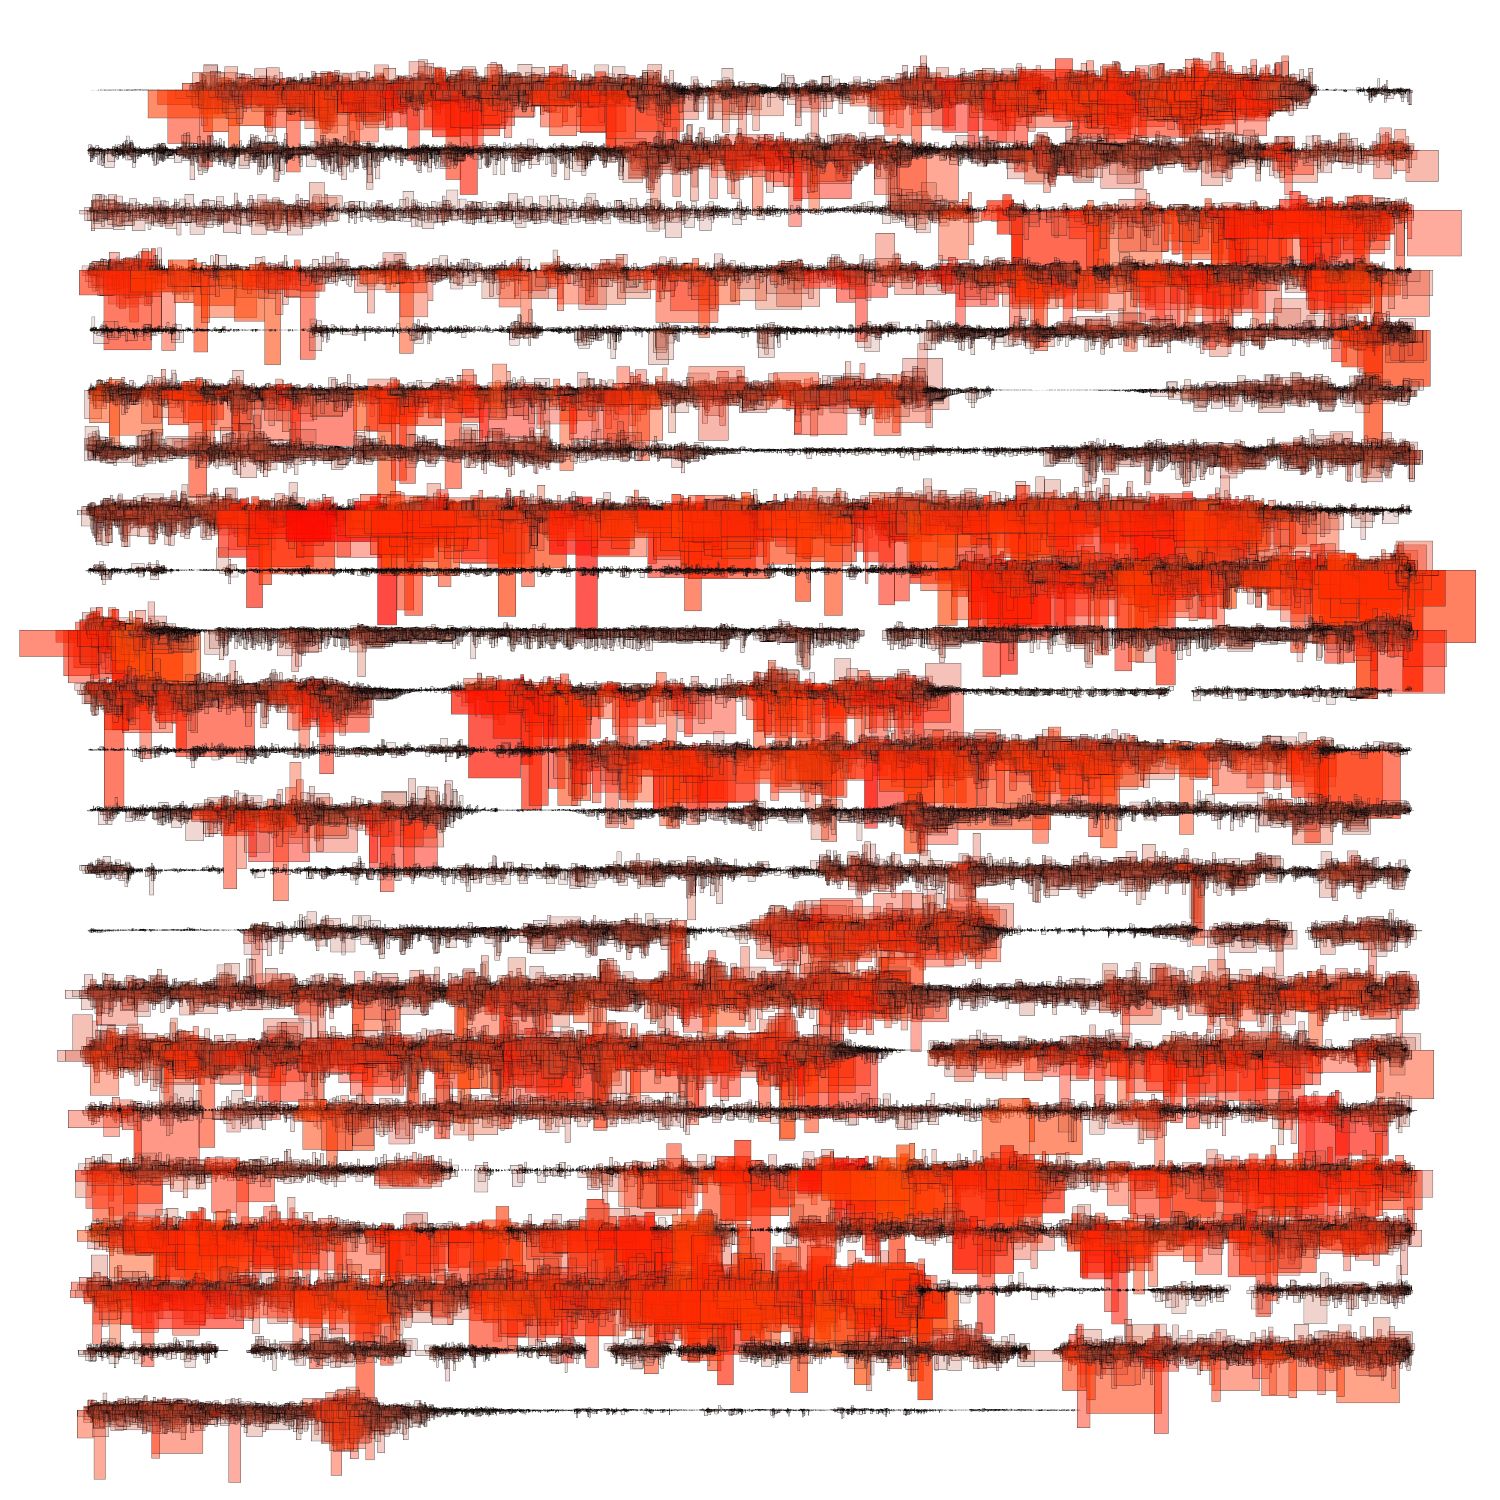
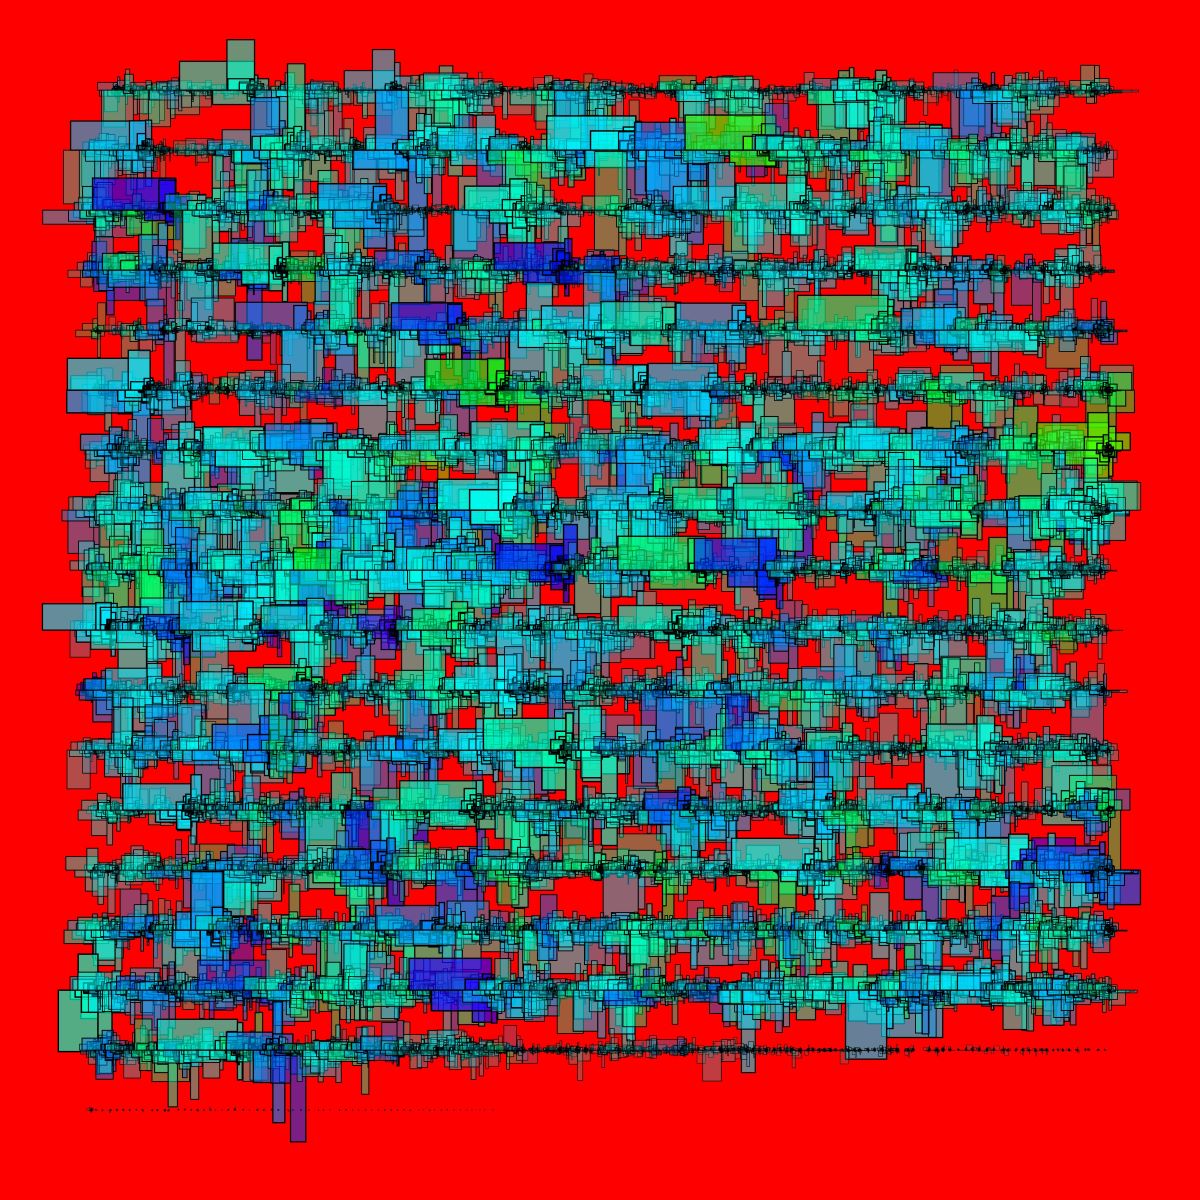
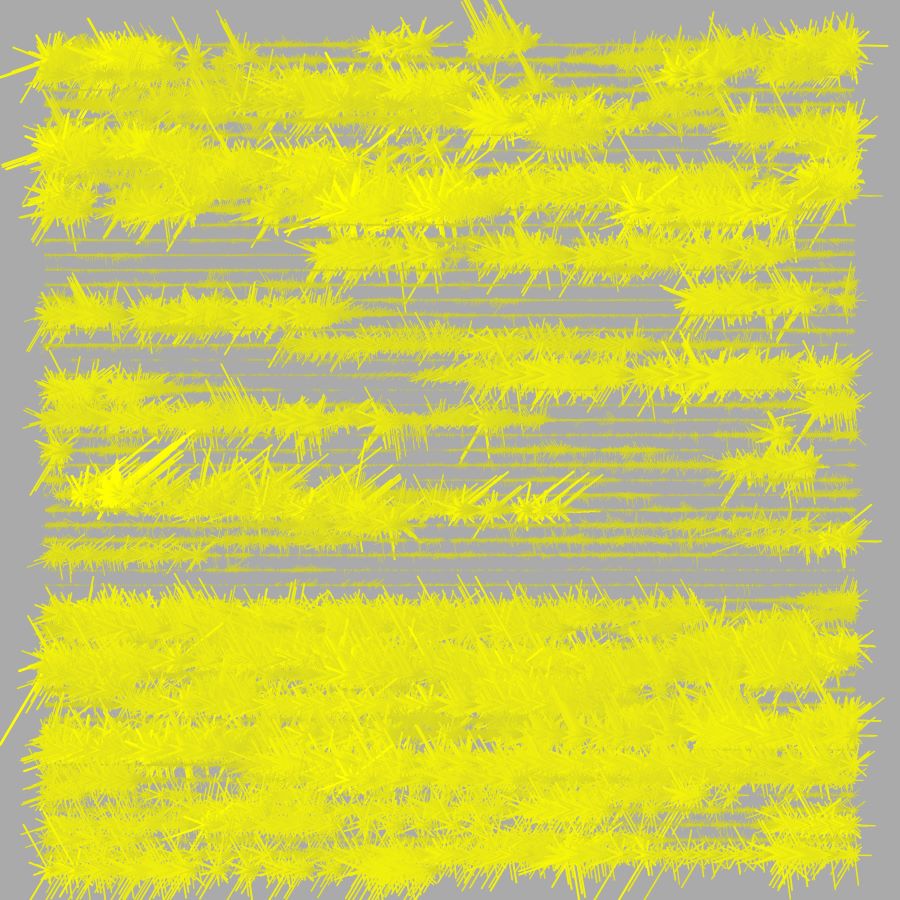
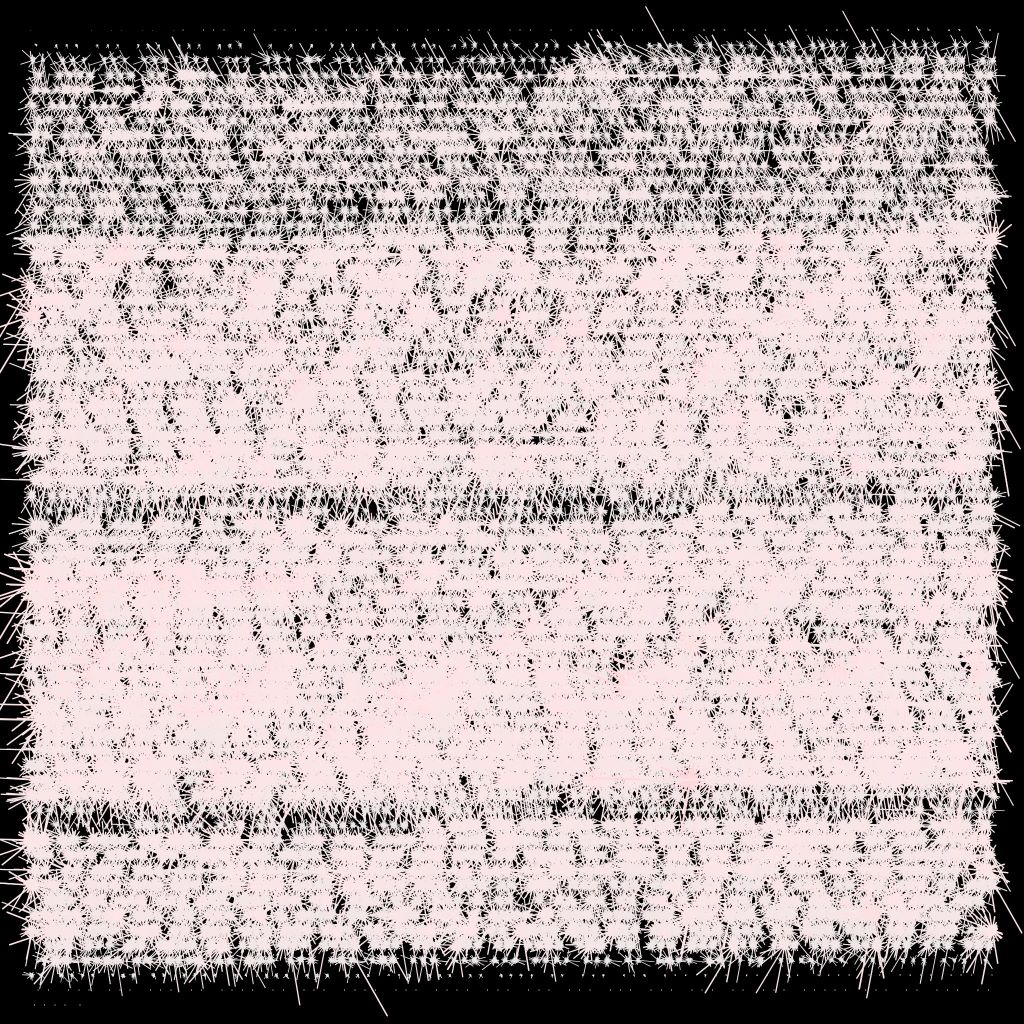
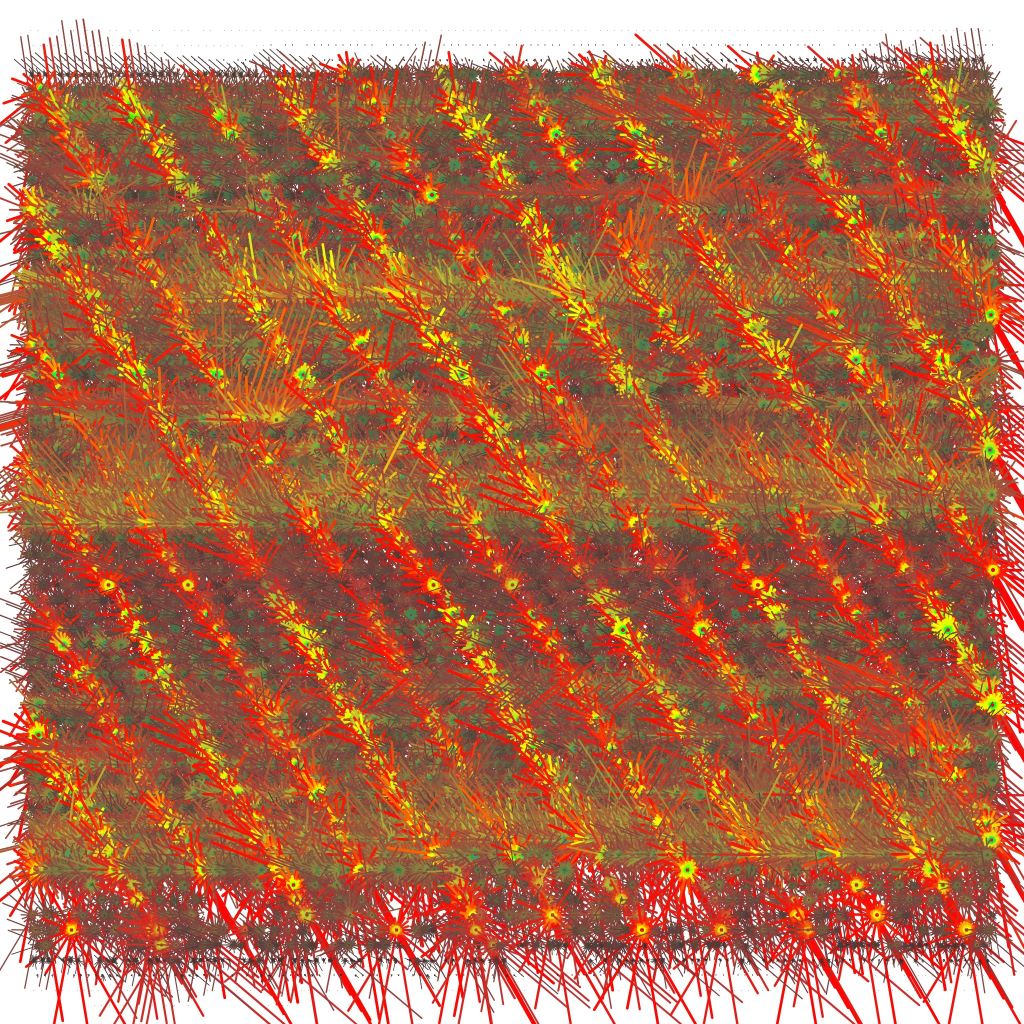
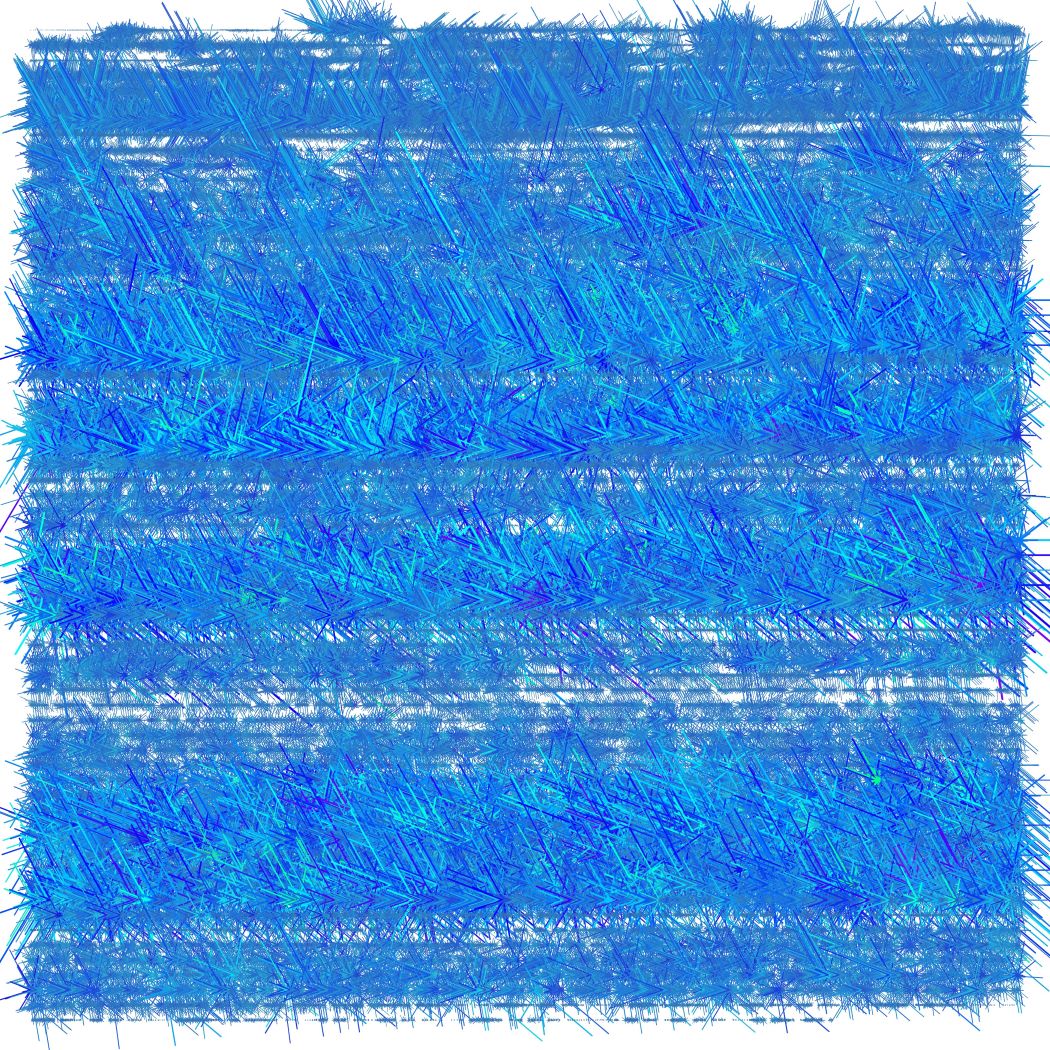
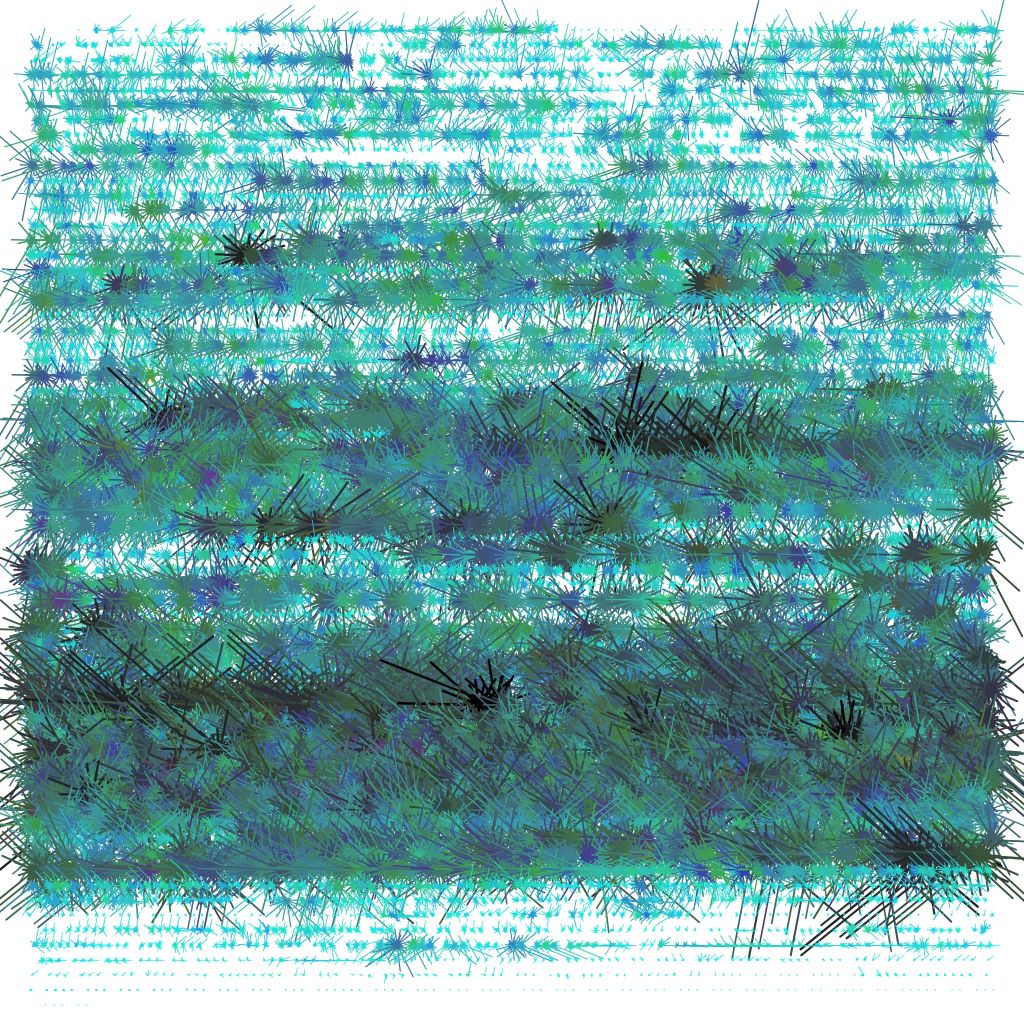
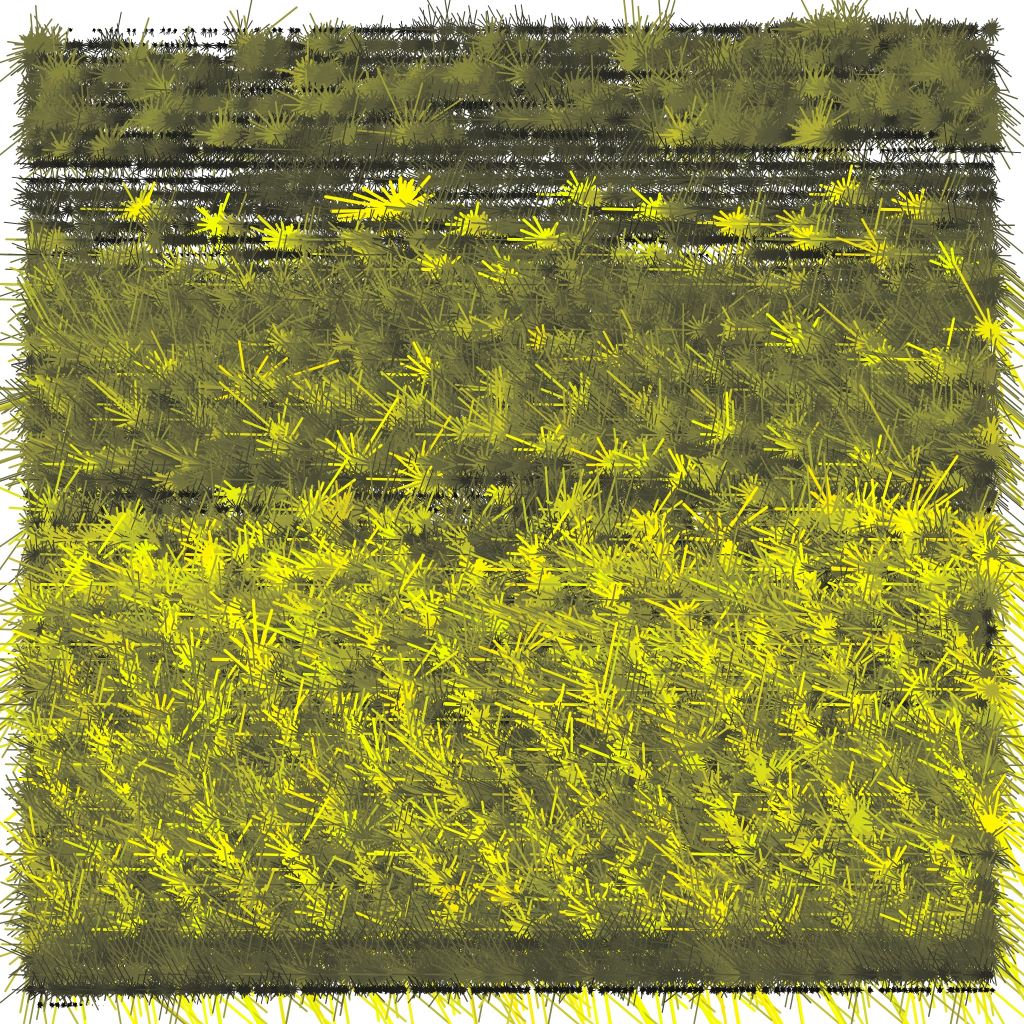
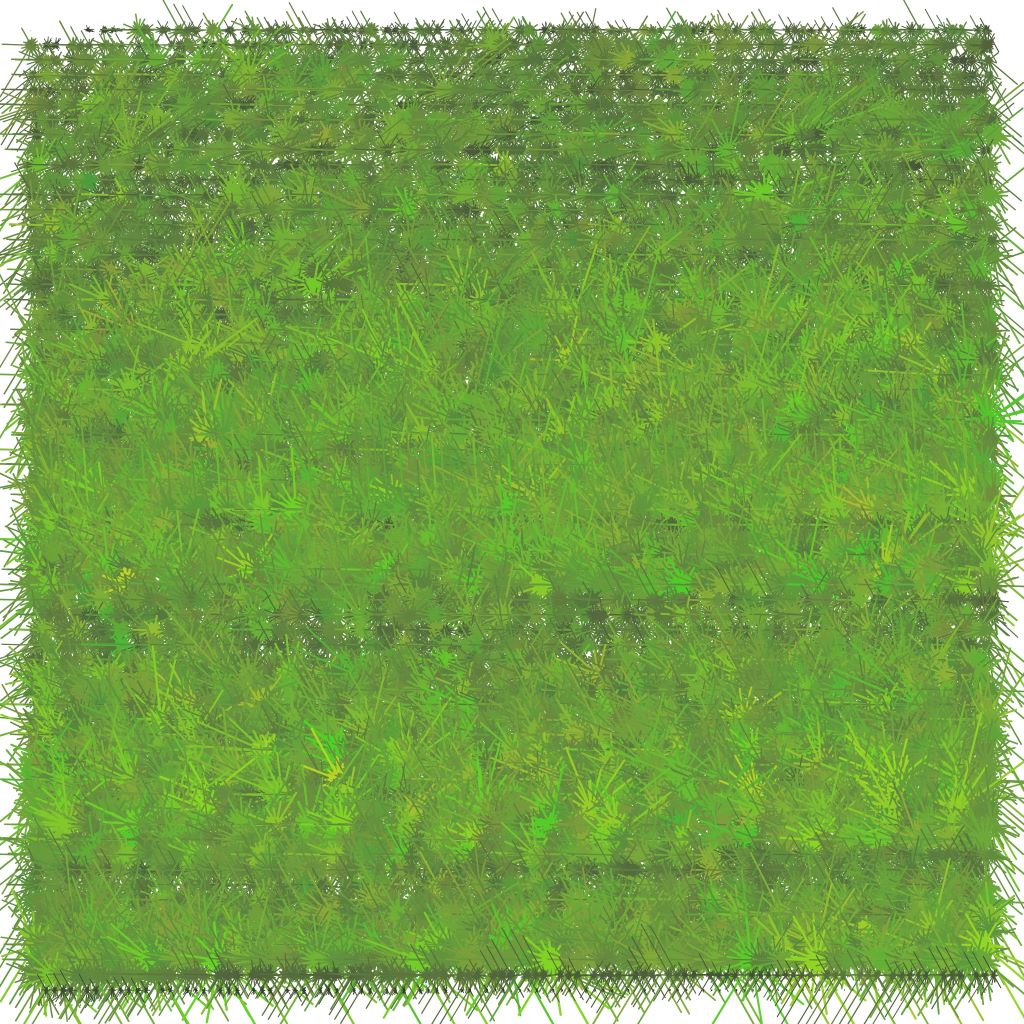
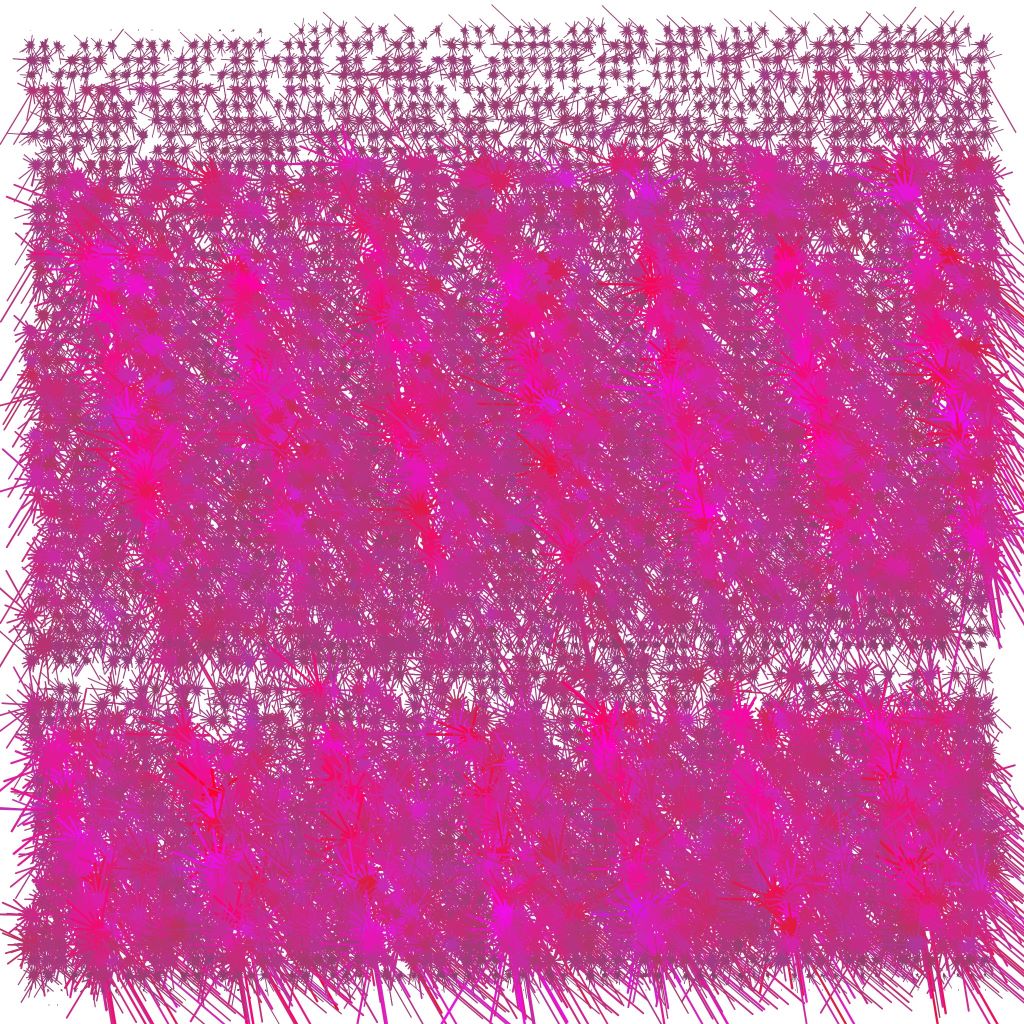
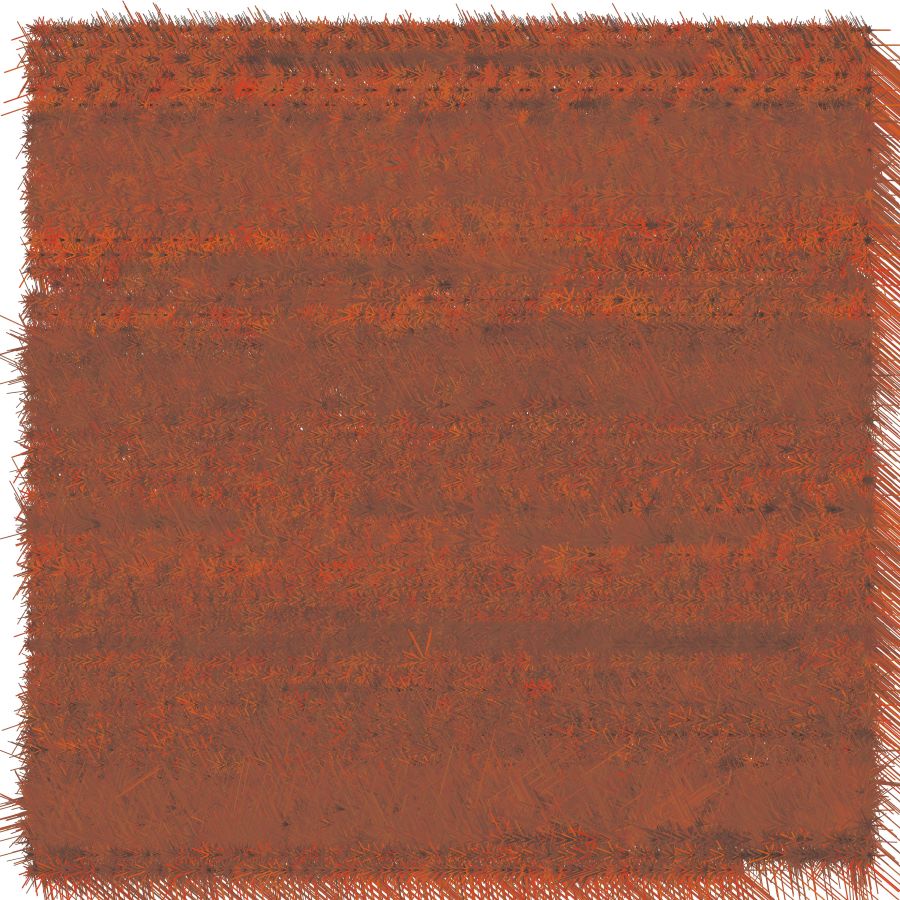
For this series I broke with one of my rules to not use any input data.
I started with the idea of producing a series of „song pictures“ using the songs audio signal as input. I was surprised myself about some of the results when trying out different songs and tweaking some parameters, and also disappointed that some good songs didn’t produce a very satisfying outcome. While playing around with different songs I tried the famous Talking Heads song „Once in Lifetime“. I was struck so much by the prayer-like line „Same as it ever was“ that I chose it as the headline for this series.
For those interested in the technical details: the song duration is mapped to the screen size and visualized line by line from the upper left corner down to the bottom right corner of the screen. For the visualization an FFT analysis of the audio signal is used and the frequency distribution is mapped to 360 degrees and displayed using lines, rectangles or shapes. Colors variation depends on the audio signals amplitude and frequency mix.